FINANCIAL PERFORMANCE
| 2019 US$ million |
2018 US$ million |
||
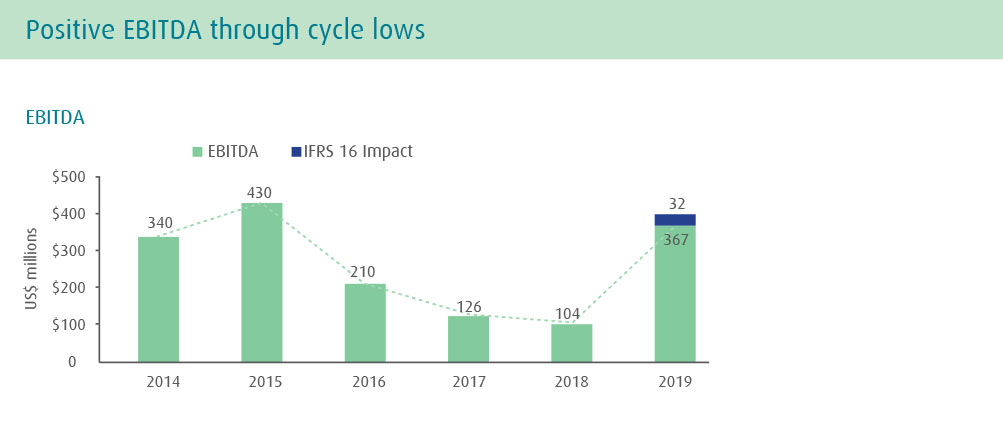
US$399mEBITDA |
Results TCE income EBITDA NPAT |
547 399 274 |
301 104 (72) |
| Balance Sheet | |||
US$274mNet profit after tax |
Vessel net book value Total assets Total cash and cash equivalents Total borrowings and lease liabilities Shareholders' equity |
1,904 2,549 112 1,282 1,177 |
2,006 2,260 50 1,235 984 |
| Cash Flows | |||
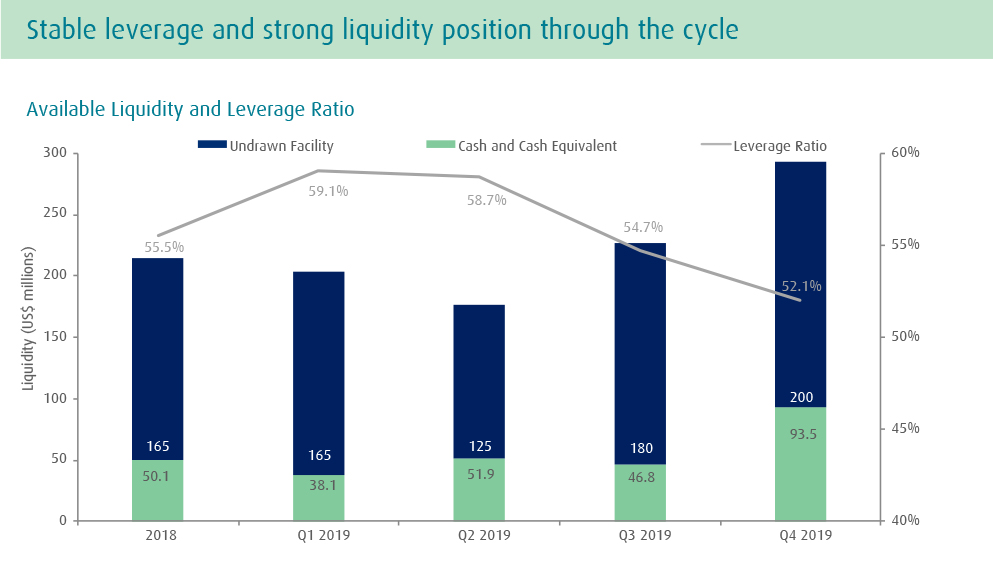
| Operating Investing Financing Available liquidity (including undrawn facility) |
322 50 (329) 294 |
89 76 (172) 215 |
US$118mTotal dividends paid |
Per Share Data | US$ | US$ |
| Earnings per share Net asset value per share Dividends per share |
1.97 8.31 0.85 |
(0.51) 7.01 - |
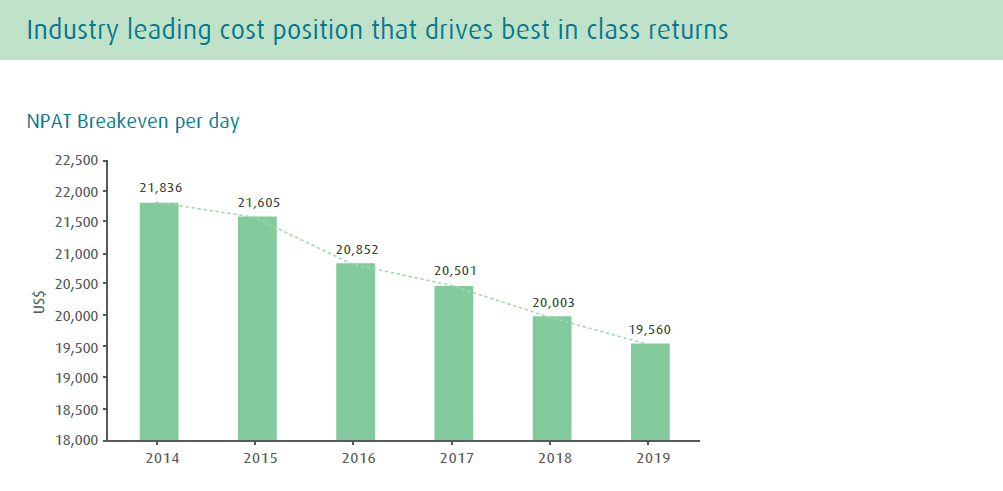
US$19,560NPAT breakdown per day |
Per Day Costs | ||
| Vessel calendar days OPEX per day* NPAT breakeven per day ** |
16,450 7,225 19,560 |
16,987 7,307 20,003 |
| Ratios | |||
| Earnings Yield Return on Equity Return on Capital Employed EBITDA Margin Leverage Ratio |
23.5% 25.3% 13.9% 72.9% 52.1% |
(16.9%) (7.0%) (1.1%) 34.6% 55.5% |
* Only for owned and bareboat-in vessels
** Adjusted for impairment charge / write-back of impairment charge on vessels, negative goodwill, and gain on derecognition of right-of-use assets